Financial Planning & Analysis
Variance Analysis Agent
Compares budget to actuals by division and explains the root cause of every material variance.
AI Impact
61%
Less time on data gathering
33%
Faster budget cycles
30%
FTEs redeployed to analysis
Key Capabilities
Variance Decomposition
Breaks variances into price, volume, and mix components
Margin Bridge
Builds visual margin walk from plan to actual
Trend Analysis
Identifies structural vs. timing variances
Management Commentary
Auto-generates variance narratives for leadership
Scenario
Aisha Binti Yusof, Senior FP&A Analyst
YTD revenue S$47M below plan — root cause analysis needed
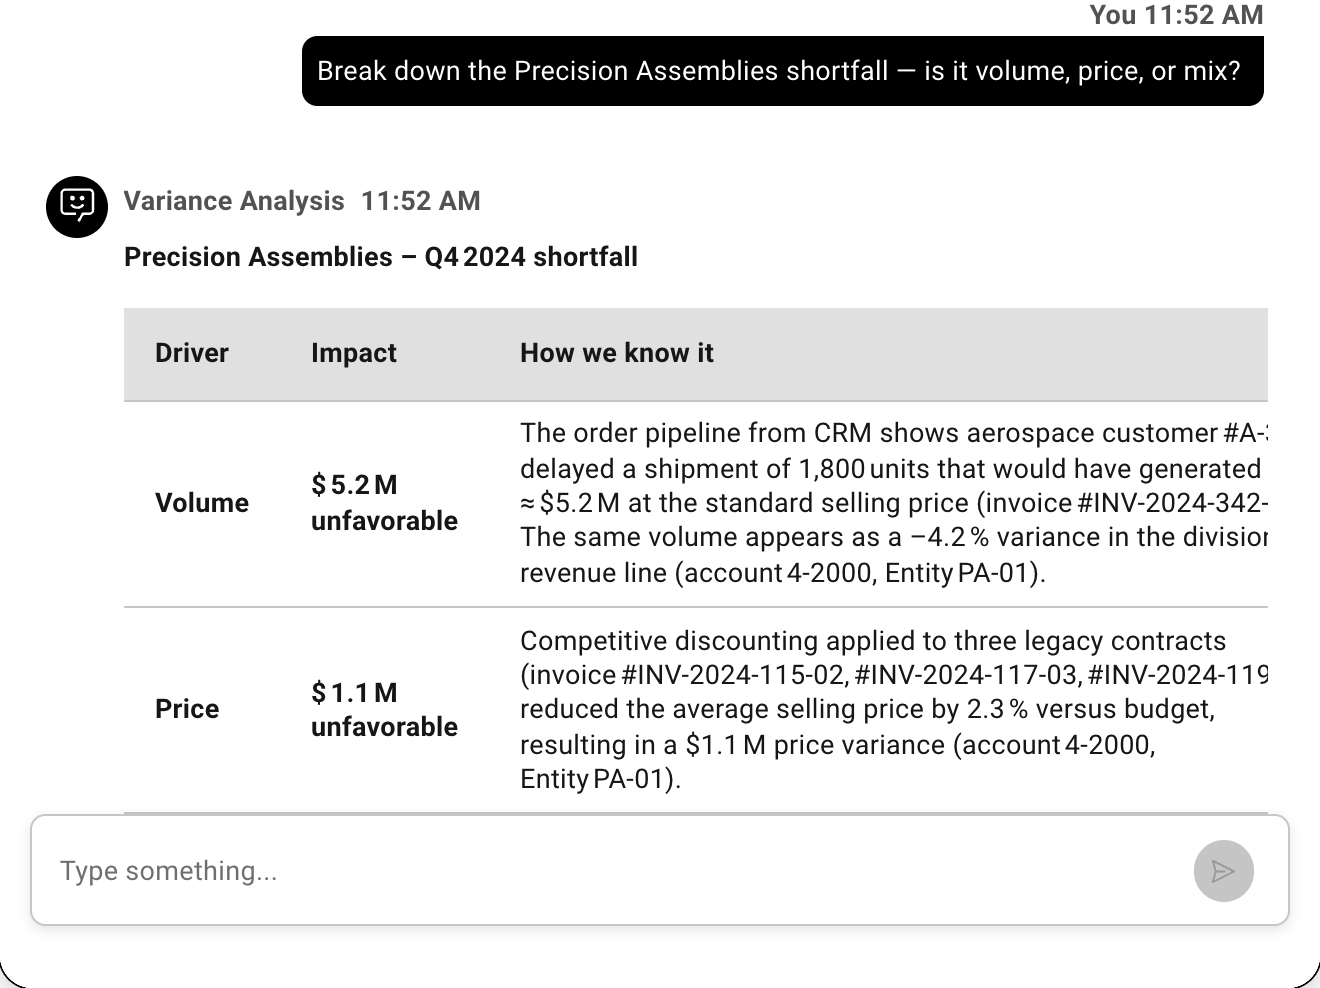
Precision Assemblies: S$30M below plan — 70% volume (ASEAN automotive delays), 30% price (China discounting), trend deteriorating
“Break down the Precision Assemblies shortfall — is it volume, price, or mix?”
Semiconductor Components: S$15M gap, but S$10M is timing — orders slipped from Q3 into Q4, not structural
“Is the Semiconductor Components gap structural or will it reverse in Q4?”
Specialty Materials: revenue on plan, but margin collapsed 3.2pp (33.0% → 29.8%) — 2.4pp commodity spike, 0.8pp mix shift building for three months
“What's driving the 3.2pp margin collapse in Specialty Materials?”